Tuesday, April 20, 2010

Always darkest before the dawn

I thought you might find this (slightly edited) excerpt from a Time Magazine article interesting:

************************************

IF AMERICA'S ECONOMIC LANDSCAPE seems suddenly alien and hostile to many citizens, there is good reason: they have never seen anything like it. Nothing in memory has prepared consumers for such turbulent, epochal change, the sort of upheaval that happens once in 50 years. That may explain why so many voter polls, taken as the economy shudders toward the November election, reveal such ragged emotional edges, so much fear and misgiving. Even the economists do not have a name for the present condition, though one has described it as "suspended animation" and "never-never land."

The outward sign of the change is an economy that stubbornly refuses to recover from the recession. In a normal rebound, Americans would be witnessing a flurry of hiring, new investment and lending, and buoyant growth. But the U.S. economy remains almost comatose. Unemployment is still high; real wages are declining. At a TIME economic forum last week, forecasters predicted that U.S. growth would amount to half the speed of a normal recovery. The current slump already ranks as the longest period of sustained weakness since the Great Depression.

That was the last time the economy staggered under as many "structural" burdens, as opposed to the familiar "cyclical" problems that create temporary recessions once or twice a decade. The structural faults represent once-in-a-lifetime dislocations that will take years to work out. Among them: the job drought, the debt hangover, the banking collapse, the real estate depression, the health-care cost explosion and the runaway federal deficit. "This is a sick economy that won't respond to traditional remedies," said Norman Robertson, chief economist at Pittsburgh's Mellon Bank. "There's going to be a lot of trauma before it's over."

********************************************

By the way, the article appeared in the September 28,1992 issue of Time. Thanks to Professor Mark Perry for the link.

Wednesday, April 14, 2010

America is back!

Here is the cover of the latest issue of Newsweek magazine. Does it have any significance for the contrarian trader?

In my book I emphasized that the goals of the contrarian trader are to identify stock market crowds as they form and to determine the point at which the crowd begins to disintegrate. I think this cover shows that the extreme bearish sentiment among stock market traders and investors that prevailed only 12 months ago has begun to lift. The bearish crowd of a year ago is well along the path to disintegration. And a bullish crowd may well be forming.

But if a bullish crowd is forming it still has a long way to go before its views dominate the U.S. stock market. This cover is one of the very first significant instances where main stream media are showing more optimism about the U.S. economy. I think economic optimism will eventually translate into stock market optimism (but note this cover doesn't mention the stock market explicitly).

So I conclude that if anything this cover is a buy signal for investors. It shows that a bullish stock market crowd is beginning to form but is still in its youthful stage. As the crowd matures stock prices will go higher. Near the bull market top I expect to see many more positive stories about the economy, and several stories about how well stock market investors are doing.

Monday, April 5, 2010

Apple Bubble


A pair of the latest magazine cover stories has caught the eye of Paul Montgomery, today's foremost practitioner of contrary opinion technique and the inventor of the magazine cover indicator. (You can read more about Paul on page 212 of my book.)

Above this post you can see images of the latest covers of Time magazine and Newsweek. They feature Steve Jobs and his latest product, the i-Pad. From his research on magazine covers Montgomery discovered that the appearance of a CEO or his company's product on the cover of a general interest newsweekly like Time or Newsweek is often associated with an important high or low in the company's stock. I discuss this magazine cover indicator on pages 92-95 of my book.

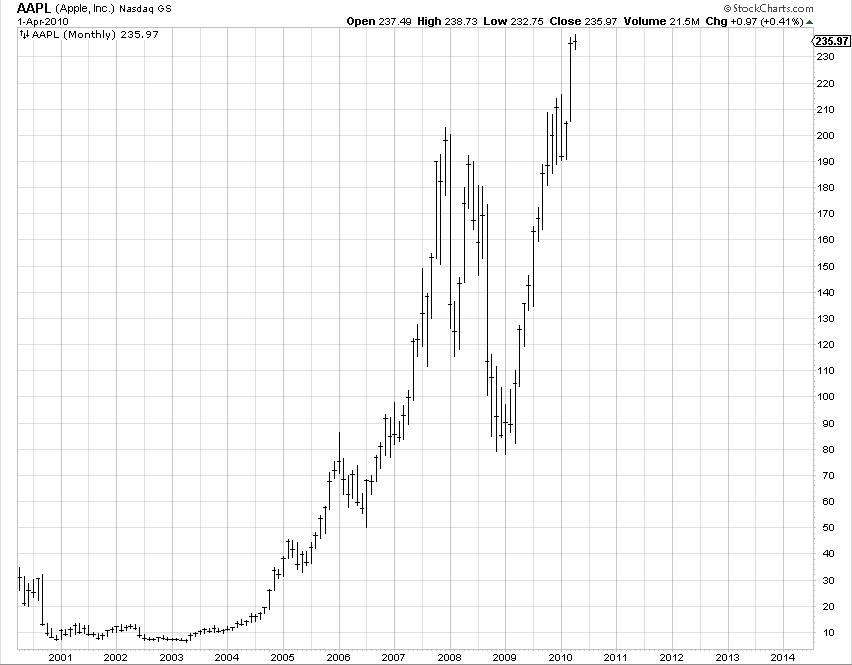
As you can see from its monthly bar chart Apple Computer (AAPL) has nearly tripled in price over the past year. It has been one of the leaders of the current bull market. But the two magazine covers above are warning us that public enthusiasm for Apple Computer has reached bubble levels. Montgomery has found that in this sort of circumstance the final high of the company's stock price follows the publication of the cover stories by about 4 months on average. On this basis we should expect AAPL to move higher for the next 3 or 4 months. But 12 months from now it is very likely that AAPL will be selling substantially lower that it is now.

Wednesday, March 31, 2010

The Sweet Spot


At the top of this post you will find an image of the business section front page from today's New York Times. Six months of relative stability in crude oil prices (red oval) has attracted the attention of the Times. I'm sure a lot of people have noticed this, but I think the situation is about to change.

One of my primary reasons is that oil competes with natural gas in power generation. And recent technological advances in natural gas extraction technique have vastly expanded the amount of recoverable gas supplies the word over. This dramatic shift in supply conditions has made itself felt in the natural gas market (middle chart). I think a big drop in oil prices lies dead ahead. I think crude will drop below the $30 level.

Monday, March 8, 2010

Mutual fund flight


Here are two charts which appeared in today's "Abreast of the Market" column in the Wall Street Journal. The bottom chart shows the cumulative money flow into U.S. stock market mutual funds (pink graph) and into foreign stock market mutual funds (blue graph). As you can see investors have been pulling substantial amounts of cash out of mutual funds that invest in U.S. stocks and putting that much and more into foreign stock market mutual funds.

It is quite unusual to see such a prolonged outflow from U.S. stock market mutual funds. This is yet another piece of evidence that global investors are generally bearish on U.S. stock prices. And it tells me that the bull market that began in March of 2009 has much further to go.

The fact that there has been such a substantial inflow into foreign stock market funds by global investors I see as evidence that these investors are bearish on the U.S. dollar. I take this to be more support for my contention that the dollar has begun a new bull market which will carry the US dollar index to the 100 level.

Finally, the top chart above this post shows shows enormous inflows into various U.S. bond market sectors. This contrasts with the outflows from the U.S. stock market. Apparently investors who want to invest in the U.S. markets think that bonds are a better bet than stocks. This is a piece of evidence which supports my view that the U.S. and global bond markets have begun a multi-decade trend towards lower prices and higher yields.

Tuesday, February 16, 2010

Building the Wall of Worry


Here are the latest covers of Newsweek and The Economist. How do they make you feel?

Do these covers make you want to increase your exposure to the stock market?

Probably not. That's why I see them as the latest bricks laid atop the wall of worry. The more bricks the media lay on the wall, the higher stock prices can climb.

Monday, February 8, 2010

Buying opportunity


If you have read my book and been following this blog you know that the aggressive contrarian trader purchased an above-normal long position near the 690 level in the S&P near the March 2009 low. The aggressive contrarian is still holding this position. More than 9 months have passed since the low. So now he is waiting for the 50 day moving average to turn down by 1% from its recent high near the 1114 level (blue line in the chart above). According to the trading strategy for the aggressive contrarian that was discussed in my book's chapter 11 such a turn down in the moving average would cause him to sell his entire long position.

However, in the current situation I think that even if the 50 moving average does turn down by 1% the aggressive contrarian should stick with his above-average long position and not sell it. Here's why.

For the first time since the March 2009 low point the stock market was mentioned in a New York Times headline - see the image above of the February 5, 2010 front page. The headline shows a moderate but not extreme amount of bearish sentiment, about what you would expect from a decline that has lasted only 3 weeks. For many examples and a thorough discussion of extremely bearish setiment in newspaper headlines read my book.

The fact that this headline appeared on the day that the market matched the length in percentage terms of the previous biggest drop within the up swing from the March 2009 low makes the headline doubly significant as a buying opportunity. Finally note that the market has dropped well below its 50 day moving average, and at Friday's low was just 2% above its 200 day moving average.

This combination of circumstances is a buy opportunity for the aggressive contrarian as I discussed in chapter 11 of my book. But since he already has an above-normal long position I think he should just stick with it. The only event that could alter the situation would be an S&P 500 close at least 5% below its 200 day moving average. Such a close would suggest that the market has begun a new bear market. I don't think we will see such a close any time soon.